Whole Life vs Indexed Universal Life (IUL) | Top Whole Life
Whole Life vs Indexed Universal Life
When shopping for permanent life insurance, most people end up comparing two products:
- Whole life insurance
- Indexed universal life insurance (IUL)
On the surface they look similar — lifelong coverage, cash value, loans. The mechanics are not the same.
2026 takeaway: Whole life buys contractual guarantees (level premium, guaranteed cash value schedule) plus a non-guaranteed dividend from a mutual carrier. IUL buys premium flexibility and capped index-linked interest, with a rising cost of insurance that you have to fund forever. The product that “looks better” on an illustration is usually the one with the weaker guarantees.
Benefits of Whole Life Insurance
Four points that make whole life the default for many long-term buyers:
- Guaranteed death benefit as long as you pay the premium
- Fixed premium that does not increase as you age
- Option to borrow against cash value
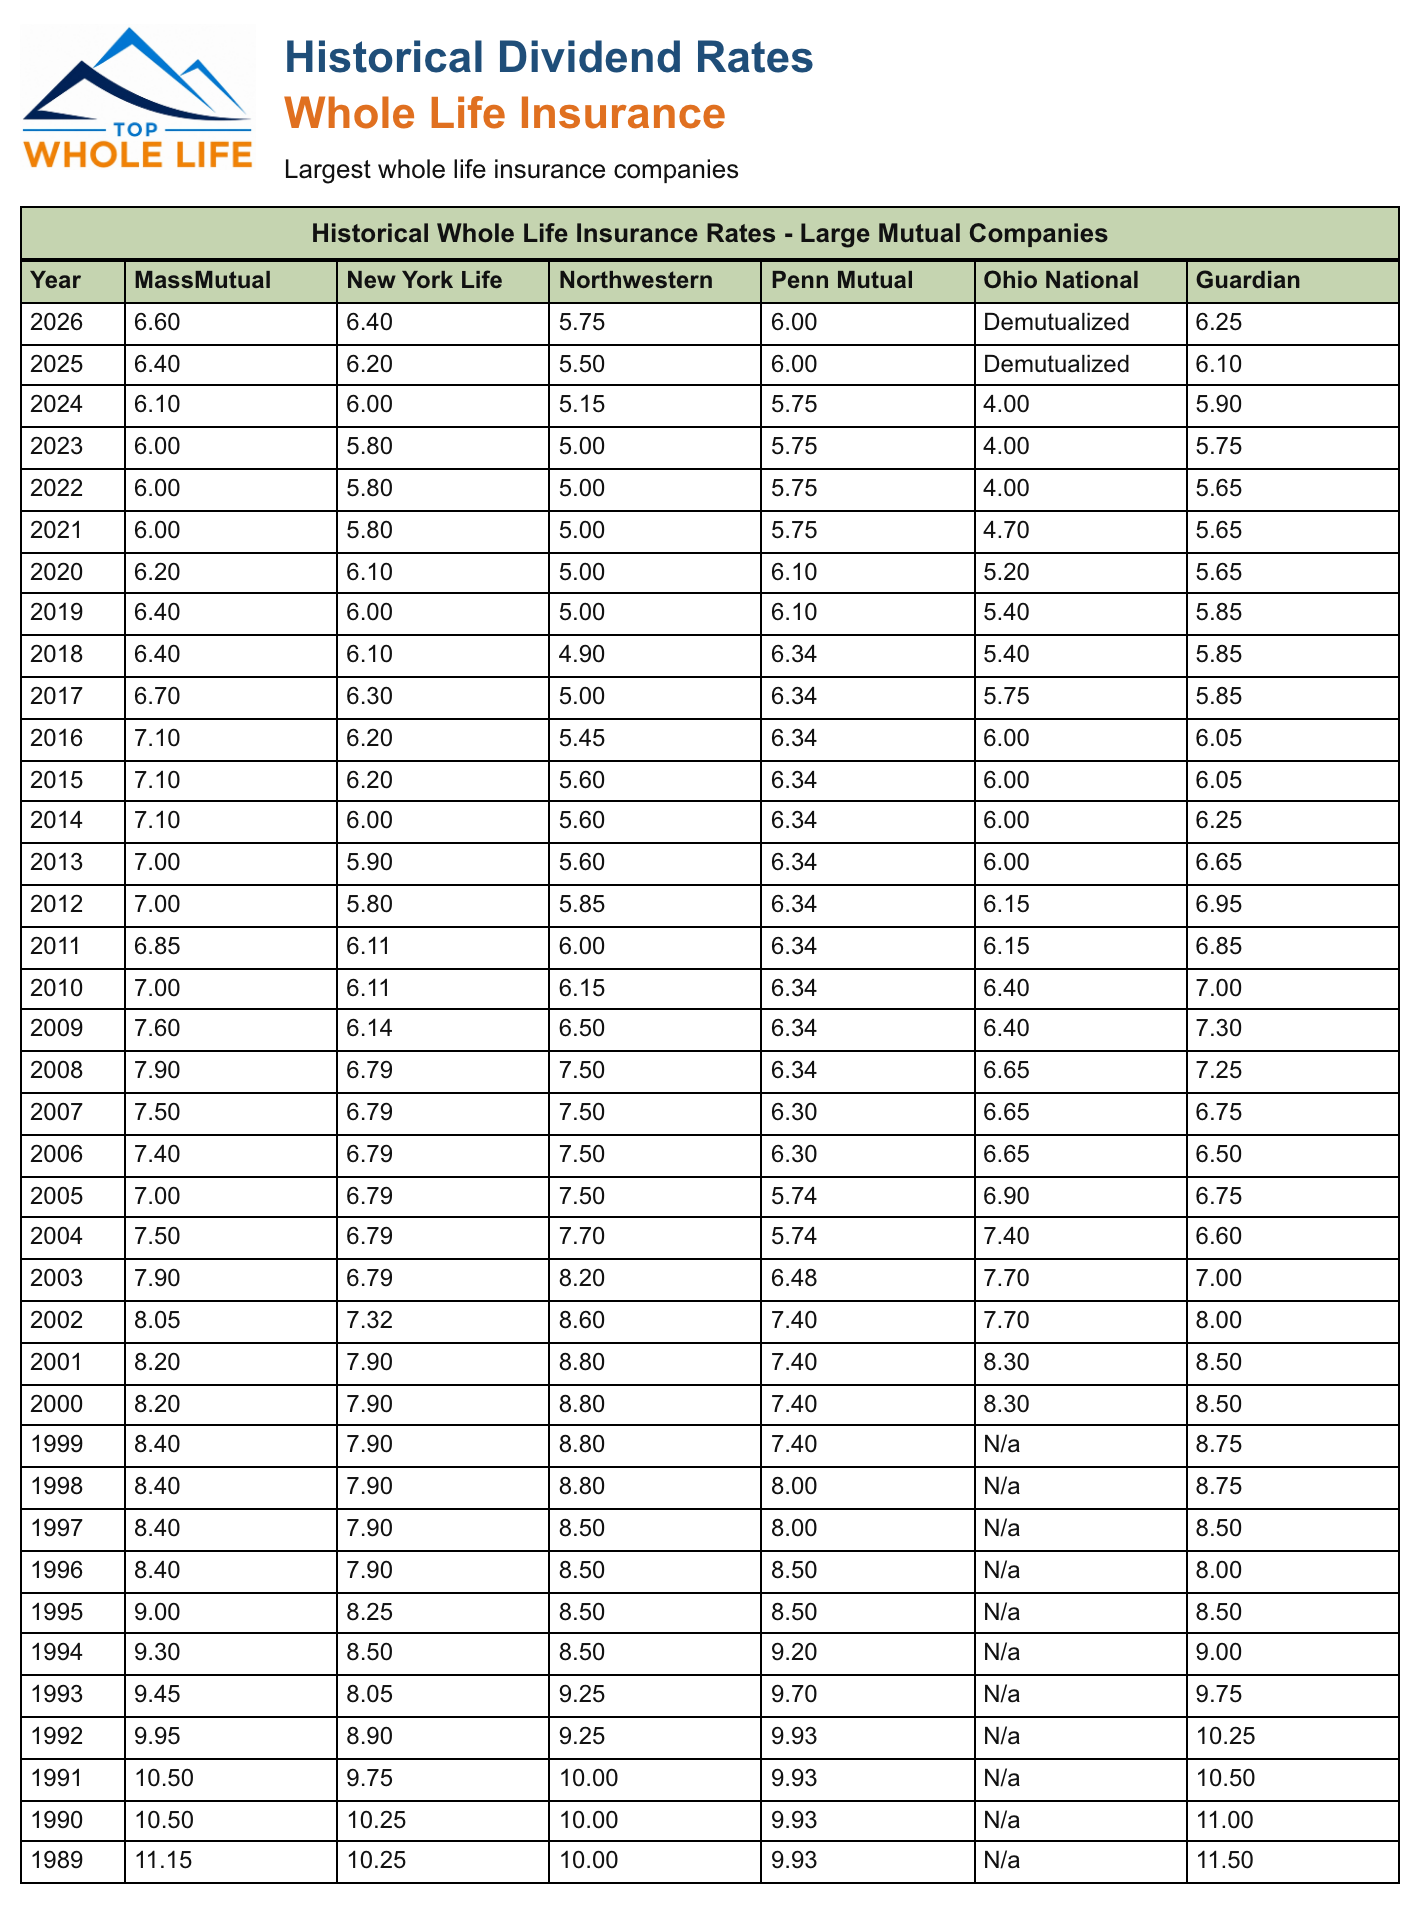
- Opportunity to earn dividends from a mutual company (see 2026 dividend rates)
These are why consumers often choose whole life instead of whole life vs term.
Benefits of Indexed Universal Life
IUL is newer and more flexible. Reasons people shop it:
- Permanent death benefit (if the policy stays funded)
- Flexible premiums within policy limits — see indexed universal life cost
- Cash value that can earn interest tied to an index (with a cap and a floor)
- Option to borrow against cash value
- Upside potential in strong index years — subject to the cap
Despite the similarities, IUL is the riskier of the two. Cash value can be depleted by rising cost of insurance, and the policy can lapse. That risk exists on any whole life vs universal life comparison — it does not mean every IUL fails, but it is a real design risk.
A properly designed, adequately funded policy can stay in force for life. For a quote, start here: indexed universal life quote.
Cap, Floor, Participation... Let's Get Technical
IUL has more moving parts than whole life. If you are considering one, work with a broker who actually designs these policies — not someone who only sells the illustrated rate.
Cap Rate
A maximum rate of return you can earn on the index credit for that period.
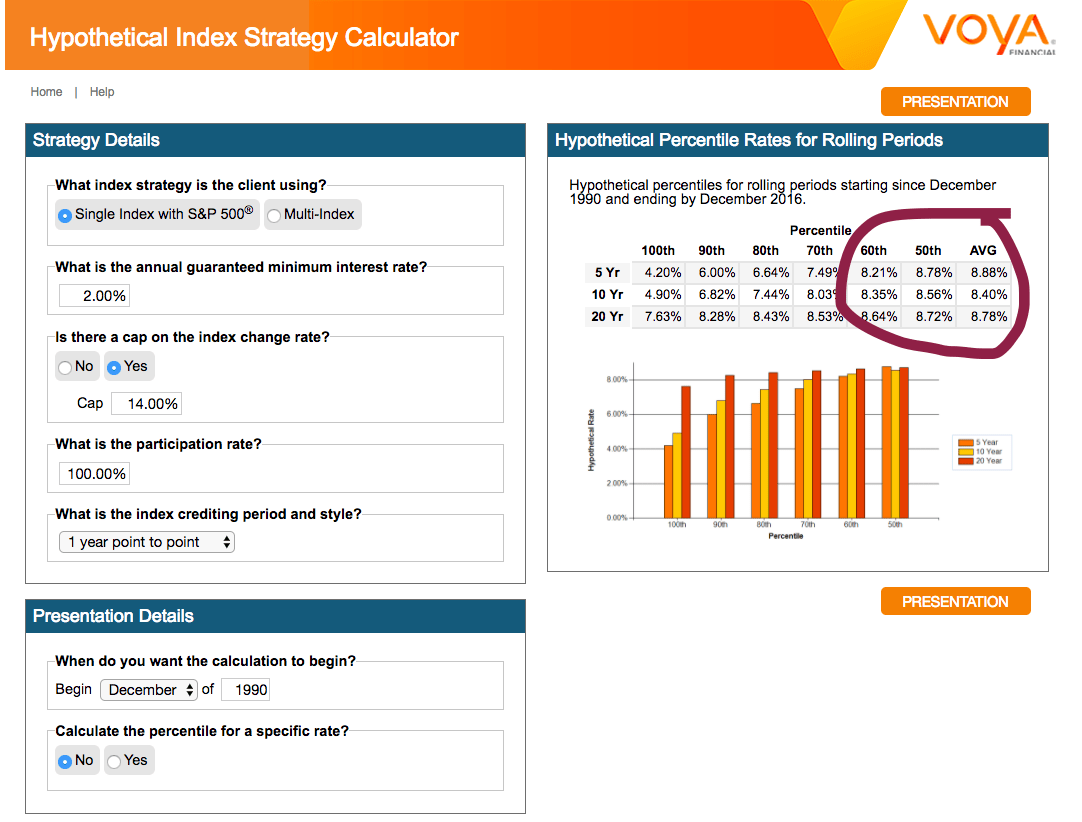
Common 2026 new-issue S&P 500 annual point-to-point caps are roughly 9–12% (older marketing often said 10–14%). If your cap is 10% and the S&P 500 price return is 20%, you are credited 10%.
Caps are not locked for the life of the policy. Carriers can lower them after issue.
Floor
The minimum credited interest for the period. Most products use a 0% floor — you do not lose money to a down market on that index credit. Some offer a 1% floor.
The floor protects the credited interest for that segment. It does not stop cost of insurance and fees from reducing cash value.
Participation Rate
How much of the index move you receive before the cap. If the S&P 500 is up 25% and participation is 100%, your raw credit is 25% (then capped). At 50% participation, the raw credit is 12.5%.
On capped S&P accounts, 100% participation is common. Uncapped / volatility-controlled accounts often use lower participation instead of a hard cap.
Cost of Insurance
This is the real pressure point on universal life. Cost of insurance (COI) is what you pay to keep the death benefit in force. As you age, COI rises. Cash value is used to cover it when premiums are not enough.
Be careful if you treat an IUL as a retirement paycheck and withdraw too much. Underfunded policies are the ones that blow up.
Confused yet?
Yes — these products are easy to pitch (“no downside, upside potential”) and hard to live with if design is weak. Proper funding matters more than the marketing cap rate.
What 2026 illustrations actually assume
Concepts are not enough. Here is what buyers are typically looking at on 2026 illustrations and rate sheets. These are market ranges, not a quote from a specific carrier — your illustration will differ.
| Assumption | Whole life (2026) | IUL (2026 typical new-issue) |
|---|---|---|
| Growth story on the page | Dividend interest rate (DIR) | Illustrated index crediting rate |
| Current headline rates | MassMutual 6.60%, New York Life 6.40%, Guardian 6.25%, Penn Mutual 6.00%, Northwestern Mutual 5.75% (full history) | Often ~5.5–7% every year under AG 49-B |
| What that number really is | An input to the dividend formula — not your policy IRR. Real geometric return is often closer to 4–5% after costs | A regulatory max built from current caps/floors and historical index math — not a forecast |
| Upside limit | No stock-market cap; dividend can change year to year | S&P 500 annual PTP caps commonly ~9–12%; participation often 100% on capped accounts |
| Downside on credited interest | Guaranteed cash-value schedule (contractual) + non-guaranteed dividend | Floor usually 0% (sometimes 1%) on the index credit |
| Premium | Level for life (on traditional designs) | Flexible — but COI still rises with age |
| What can change after issue | Dividend can go up or down | Caps, participation, and illustrated rates can be cut; COI charges can change within policy limits |
| Index / dividends | N/A (general account + dividend) | Most index accounts use price return (S&P dividends excluded) |
How to read this table: A whole life illustration showing today’s DIR looks conservative next to an IUL showing 6.5% every year for 40 years. That IUL line is a sales document under AG 49-B, not a prediction. Run the calculator below to see what capped credits looked like on real S&P years.
Biggest Problems With Whole Life
Very little cash early
Most whole life products do not build much cash value early. Some carriers offer designs with up to ~90% of premium as year-1 cash value, but many agents avoid them because commissions drop (contact us at quotes@topwholelife.com for those designs).
A vanilla whole life can take years before cash is meaningful to borrow.
Conservative rates of return
Whole life will not illustrate as aggressively as IUL. It is the more conservative product — and it has contractual guarantees IUL does not.
Dividends can fluctuate
Top whole life policies are usually dividend-paying. The dividend is non-guaranteed and moves with interest rates and company performance. Carrier strength matters as much as this year’s DIR.
Biggest Problems with Indexed Universal Life
If an IUL is not properly designed, you need to know:
- Premiums may need to increase later to keep the policy healthy
- Credited interest depends on index performance (subject to cap/floor) — there is no dividend-style guarantee
- The contract is harder to understand than whole life
High illustrated returns attract buyers. If funding is light, cash value may not keep up with rising COI, and the policy can lapse later in life when returns are weak.
Overfund Your IUL
A properly overfunded IUL can be a strong product for the right person.
What is overfunding? Increasing premium (and cash value) without increasing the death benefit. More dollars go to cash value. Many agents will not show this design because their commission is cut.
If you have an IUL illustration and are unsure whether it is overfunded, send it to us — we will review the funding and show what a higher-cash design looks like.
Inflated Rates Of Return
IUL can be sold on numbers that are allowed but still misleading. Regulators tightened this with Actuarial Guideline 49 and later updates (AG 49-A, AG 49-B, effective for new issues from May 2023). Among other limits, AG 49-B constrains maximum illustrated index rates (using current caps/floors on historical index behavior) and limits loan-arbitrage assumptions (illustrated loan credit generally cannot exceed the loan charge by more than about 100 basis points).
Even with those limits, a flat 6% or 7% every year for decades is not how markets — or capped index accounts — behave.
Index Calculator
Illustrations still show the same credited rate every year. Real S&P 500 price returns bounce between big up years (capped) and down years (floored). Use the tool below to compare a straight illustrated rate to what a cap + floor + participation would have credited on actual calendar years.
The Final Verdict
Whole life vs IUL depends on the person, the funding, and the job the policy needs to do.
| You care most about… | Lean toward… |
|---|---|
| Guarantees, level premium, simpler contract | Whole life |
| Maximum illustrated “growth” on a sales page | Be skeptical — ask for guaranteed and mid-point scenarios |
| Flexibility and overfunded cash value with index upside | Overfunded IUL (designed carefully) |
| Borrowing against a predictable cash schedule | Participating whole life |
| Lowest premium for a large face amount | Often IUL on paper — stress-test COI and lapse risk |
In short:
- Whole life is safe and boring
- IUL is riskier and more exciting
For most families we talk to, whole life’s guarantees outweigh IUL’s illustration upside. An overfunded IUL or an overfunded whole life can both earn a place in a portfolio — design beats product label.
I Would Like To Get A Quote Now
Get a whole life quote · Indexed universal life quote
Is whole life better than IUL?
For most people who want permanent coverage with predictable premiums and contractual cash-value guarantees, yes — whole life is the cleaner fit. IUL can work when it is heavily overfunded and actively monitored, but the rising cost of insurance and movable caps make it easier to underfund. Compare the 2026 dividend rates to what your IUL illustration assumes every year before you decide.
What interest rate do IUL illustrations use in 2026?
Under AG 49-B, new-issue IUL illustrations commonly show roughly 5.5–7% credited interest every year — a regulatory maximum built from current caps and historical index math, not a forecast. Typical S&P 500 annual point-to-point caps on new policies are about 9–12%, with a 0% floor on many products. Always read the guaranteed and midpoint columns, not only the illustrated column.
Can an IUL lose money?
The index credit usually has a floor (often 0%), so a down market year typically credits nothing rather than a negative index return. You can still lose cash value to cost of insurance, fees, and loans. If those charges exceed premiums and credited interest for long enough, the policy can lapse. That is different from whole life’s guaranteed cash-value schedule.