Whole Life Insurance Dividend Rate History [2026 Update]
Updated September 7, 2026
Whole Life Insurance Dividend Rate History Chart
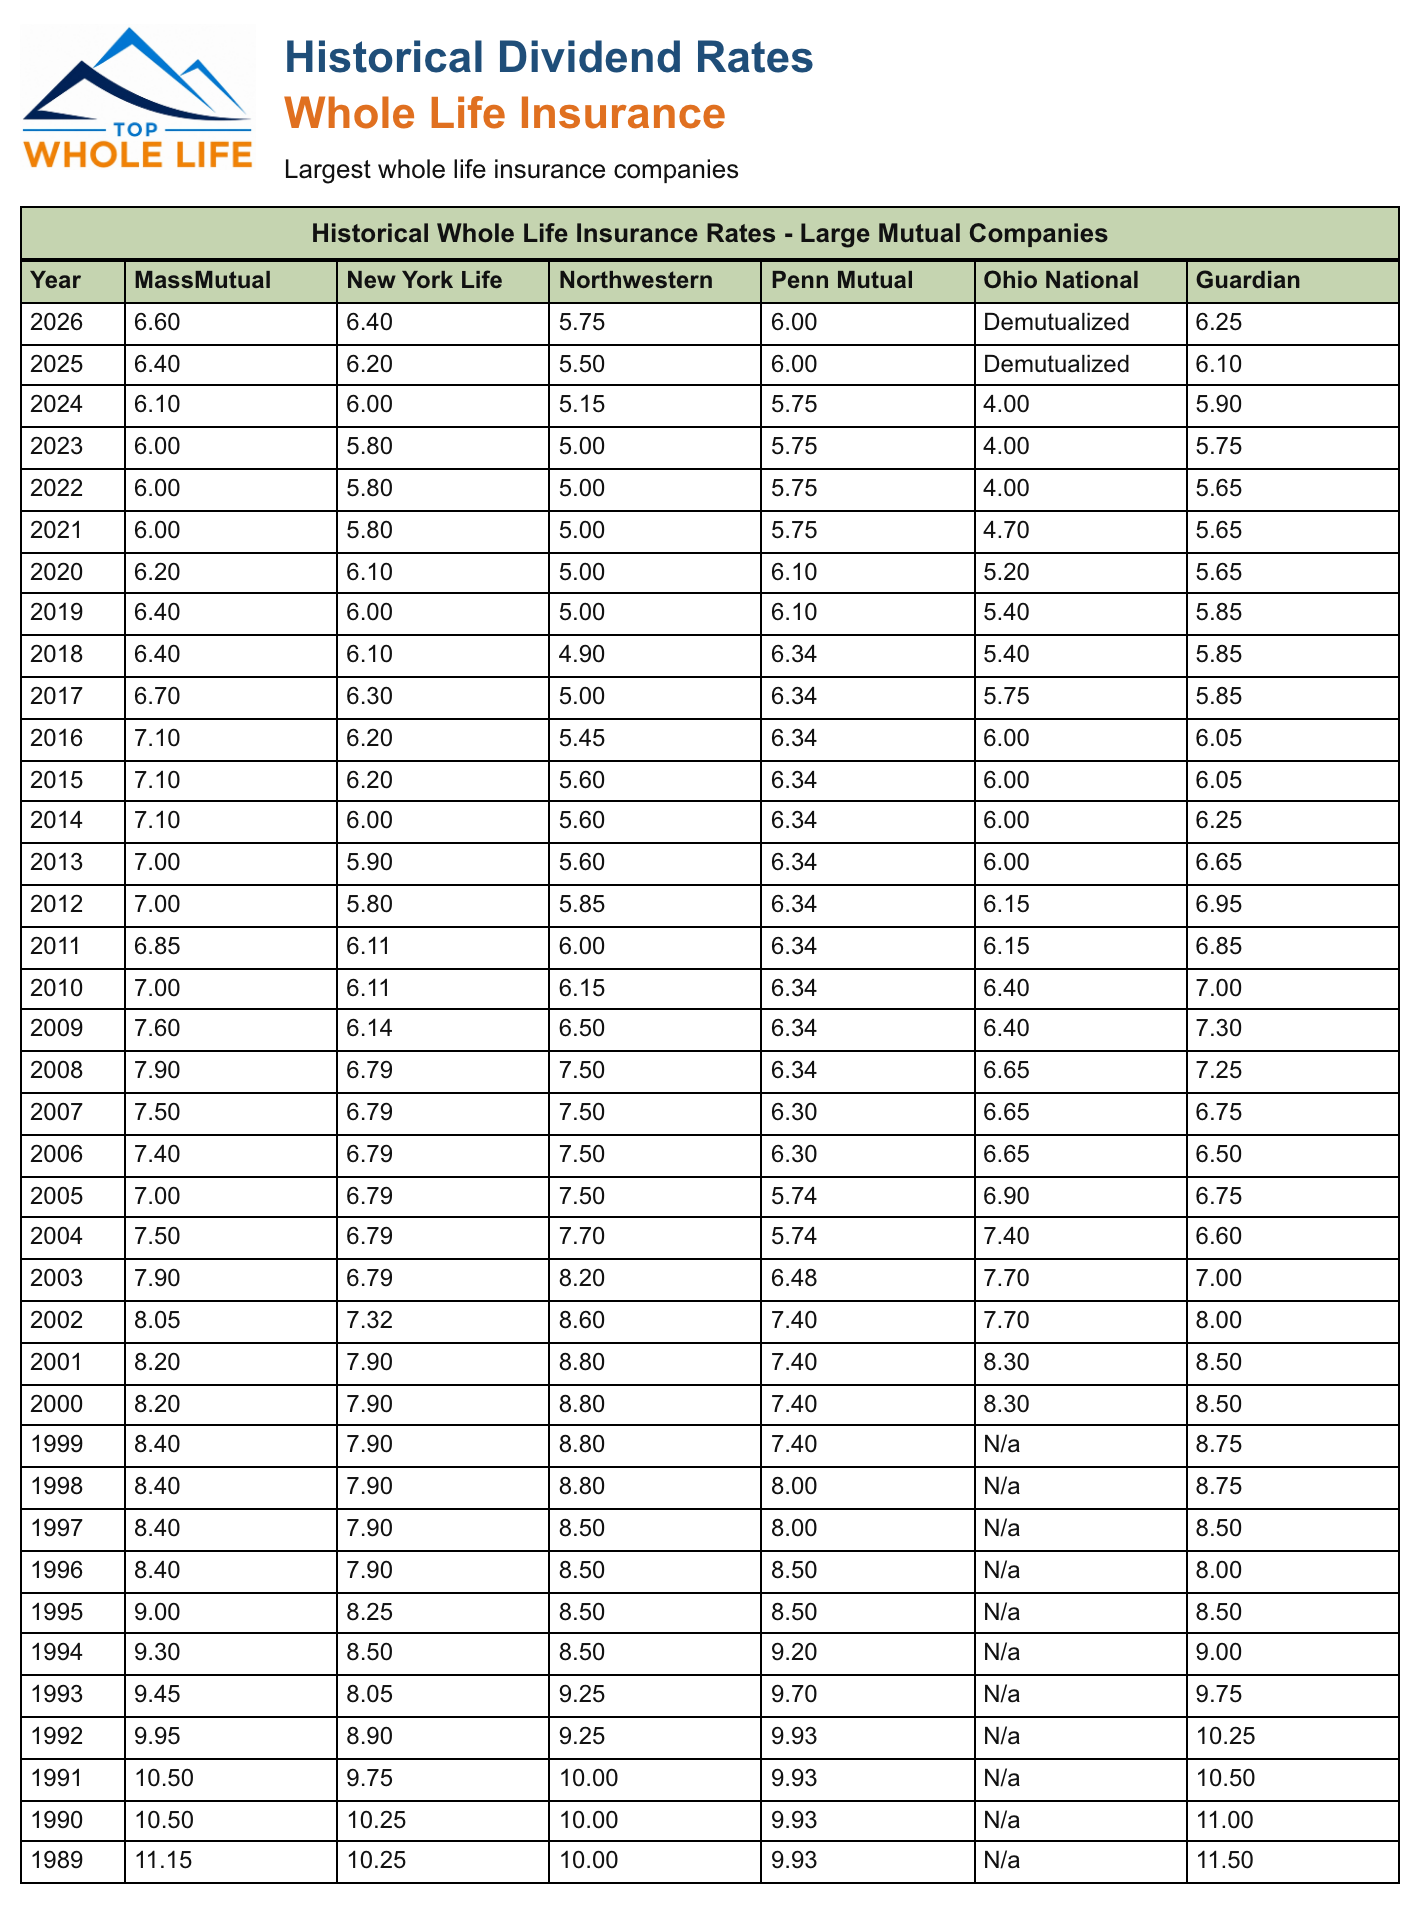
Use the chart above for a visual snapshot of how major mutual carriers compare on dividend interest rates (DIR). The tables below add year-by-year detail, 2026 announcements, and carrier-specific history for long-tail searches (e.g. Mass Mutual dividend rate history, New York Life dividend rate history).
Whole life insurance historical performance and charts with expert analysis. We have an updated list of Whole Life Insurance Dividend History.
We also go back to give you average rates for the past 5, 10, 15, and 20 years. This can help you understand where each company ranks historically. We use all this data to get our seven top whole life companies for cash value every year.
The next table is only relevant for participating policies. Participating policies pay a dividend, and it is a huge part of the performance of the cash value.
If you are using this data to choose a carrier, pair the table below with our 2026 comparison of the top 7 whole life insurance companies for cash value. The dividend history is the data source; the comparison explains how the carriers stack up for policy design, access to cash value, and long-term strength.
Get A High Dividend Paying Whole Life
We will get you the best dividend
What is participating policy?
A participating whole life insurance is one that pays dividends to the policyholder. The most competitive participating policies are from mutual companies.
The reason mutual companies pay dividends is that they do not have stockholders. So the only dividend they pay is to policyholders.
Why is the history of whole life dividends important?
We can take the highest dividend companies from today and pick the best one. However, we prefer to use today's rates and historical rates because it will give us a better idea of how the dividend will perform in the future.
Even though past performance doesn't indicate future performance.
We took the following Historical Whole Life Dividends (webfiles2.nfp.com) that has incredible data, and updated the numbers:
We will keep updating it, and feel free to contact us, so we add a company.
| Company | 2026 | 2025 | 2024 | 2023 | 2022 | 2021 | 2020 | 2019 | 2018 | 2017 | 2016 | 2015 |
|---|---|---|---|---|---|---|---|---|---|---|---|---|
| Ameritas | 5.10 | 5.10 | 5.00 | 4.60 | 4.60 | 4.75 | 5.00 | 5.00 | 5.00 | 5.00 | 5.15 | 5.25 |
| Guardian | 6.25 | 6.10 | 5.90 | 5.75 | 5.65 | 5.65 | 5.65 | 5.85 | 5.85 | 5.85 | 6.05 | 6.05 |
| John Hancock | NA | NA | NA | 4.25 | 4.25 | 4.25 | 4.75 | 5.00 | 5.00 | 5.15 | 5.15 | 5.30 |
| MassMutual | 6.60 | 6.40 | 6.10 | 6.00 | 6.00 | 6.00 | 6.20 | 6.40 | 6.40 | 6.70 | 7.10 | 7.10 |
| MetLife | NA | NA | NA | NA | NA | NA | 4.70 | 4.70 | 4.70 | 4.70 | 5.00 | 5.10 |
| New England Financial (Brighthouse Financial) | NA | NA | NA | NA | NA | 4.65 | 4.65 | 4.65 | 4.65 | 5.00 | 5.00 | 5.00 |
| New York Life | 6.40 | 6.20 | 6.00 | 5.80 | 5.80 | 5.80 | 6.10 | 6.00 | 6.10 | 6.30 | 6.20 | 6.20 |
| Northwestern Mutual | 5.75 | 5.50 | 5.15 | 5.00 | 5.00 | 5.00 | 5.00 | 5.00 | 4.90 | 5.00 | 5.45 | 5.60 |
| Penn Mutual | 6.00 | 6.00 | 5.75 | 5.75 | 5.75 | 5.75 | 6.10 | 6.10 | 6.34 | 6.34 | 6.34 | 6.34 |
| Ohio National | Demutualized | Demutualized | 4.00 | 4.00 | 4.00 | 4.70 | 5.20 | 5.40 | 5.40 | 5.75 | 6.00 | 6.00 |
| Foresters | NA | NA | NA | NA | NA | NA | 5.80 | 6.23 | 6.23 | 6.58 | 6.83 | 6.65 |
Whole Life Insurance Dividend Rates for 2026
Major mutual carriers have announced 2026 dividend interest rates (DIR). Across the peers that have reported so far, rates are up 15 to 25 basis points versus 2025 — a continued lift as carriers adjust to the rate environment while money-market yields ease from their peaks.
| MassMutual | 6.60 |
| New York Life | 6.40 |
| Guardian | 6.25 |
| Penn Mutual | 6.00 |
| Northwestern Mutual | 5.75 |
| Foresters | NA |
Carrier dividend rate history (2026)
Jump to each carrier’s year-by-year DIR table (major mutuals 2001–2026; Foresters 2014–2026):
- Mass Mutual dividend rate history — 6.60% DIR (2026)
- New York Life dividend rate history — 6.40% DIR (2026)
- Guardian dividend rate history — 6.25% DIR (2026)
- Penn Mutual dividend rate history — 6.00% DIR (2026)
- Northwestern Mutual dividend rate history — 5.75% DIR (2026)
- Foresters dividend rate history — NA (2026)
Estimate how dividends affect cash value
Dividend rates alone do not show projected cash value — policy design, age, and funding level matter. For a personalized illustration with current 2026 rates, use our get a whole life quote tool or compare carriers in the top whole life companies for cash value guide.
Whole Life Insurance Dividend Rates for 2025
2025 announcements for whole life dividend rates across the insurance industry have been released. To keep up with high yield savings account rates and the high Fed interest rate, the industry has had to increase dividends to continue to be attractive. The result is that dividend rates across the major whole life insurance firms are up between 20 basis points and 35 basis points. This increase in dividend yield while savings account rates are dropping should result in a positive year for Whole Life insurance, in general.
| MassMutual | 6.40 |
| New York Life | 6.20 |
| Penn Mutual | 6.00 |
| Guardian | 6.10 |
| Northwestern Mutual | 5.50 |
| Foresters | NA |
Whole Life Insurance Dividend Rates for 2024
2024 rates versus high yields savings accounts in early 2024 were just not attractive. Interest in whole life insurance for yield was challenged by risk free 5%+ money markets making whole life dividends look less attractive (Of course that is short term thinking on the part of the consumer).
| MassMutual | 6.10 |
| New York Life | 6.00 |
| Penn Mutual | 5.75 |
| Guardian | 5.90 |
| Northwestern Mutual | 5.15 |
| Foresters | NA |
Whole Life Insurance Dividend Rates for 2023
We are starting to get results on the 2023 announcements for dividends. All the dividends from the large mutual companies seem to have remained steady. As they come in we will update the list.
| MassMutual | 6.00 |
| New York Life | 5.80 |
| Penn Mutual | 5.75 |
| Guardian | 5.75 |
| Northwestern Mutual | 5.00 |
| Foresters | NA |
Whole Life Insurance Dividend Rates for 2022
Following are the dividend for participating policies in 2022.
| MassMutual | 6.00 |
| New York Life | 5.80 |
| Penn Mutual | 5.75 |
| Guardian | 5.65 |
| Northwestern Mutual | 5.00 |
| Foresters | NA |
Whole Life Insurance Dividend Rates for 2021
We are starting to get results on the 2021 announcements for dividends. As they come in we will update the list.
| MassMutual | 6.00 |
| New York Life | 5.80 |
| Penn Mutual | 5.75 |
| Guardian | 5.65 |
| Northwestern Mutual | 5.00 |
| Ohio National | 4.70 |
| Foresters | NA |
*This workbook has no published Foresters DIR from 2021 through 2026. Foresters historically announced on a lag versus the large mutuals; the last print here is 5.80% for 2020.
Whole Life Insurance Dividend Rates for 2020
At the end of the year, most companies start announcing their dividend rates for next year. Here are the whole life dividend rates for 2020 ahead of time. As we become aware of more, we will list them out.
| MassMutual | 6.20 |
| Penn Mutual | 6.10 |
| New York Life | 6.10 |
| Foresters* | 5.80 |
| Guardian | 5.65 |
| Ohio National | 5.20 |
| Northwestern Mutual | 5.00 |
*Foresters historically announced on a lag versus the large mutuals. 5.80% is the 2020 DIR in this workbook, not a restatement of an earlier year.
Whole Life Insurance Dividend Rates for 2019
Here is the full 2019 whole life dividend list from the largest and most important carriers.
| MassMutual | 6.40 |
| Foresters | 6.23 |
| Penn Mutual | 6.10 |
| New York Life | 6.00 |
| Guardian | 5.85 |
| Ohio National | 5.40 |
| Northwestern Mutual | 5.00 |
Whole Life Insurance Dividend Rankings for 2018
Here is a quick summary of the dividend rate from some of the largest/best companies that offer whole life insurance.
| MassMutual | 6.40 |
| Penn Mutual | 6.34 |
| Foresters | 6.23 |
| New York Life | 6.10 |
| Guardian | 5.85 |
| Ohio National | 5.40 |
| Northwestern Mutual | 4.90 |
Whole Life Insurance Dividend Rates Historical Averages
It can be hard to understand all the data, so we created a simpler way for you to look at the information. The chart below shows trailing 5-, 10-, 15-, and 20-year averages through 2026 for the major mutual carriers we track.
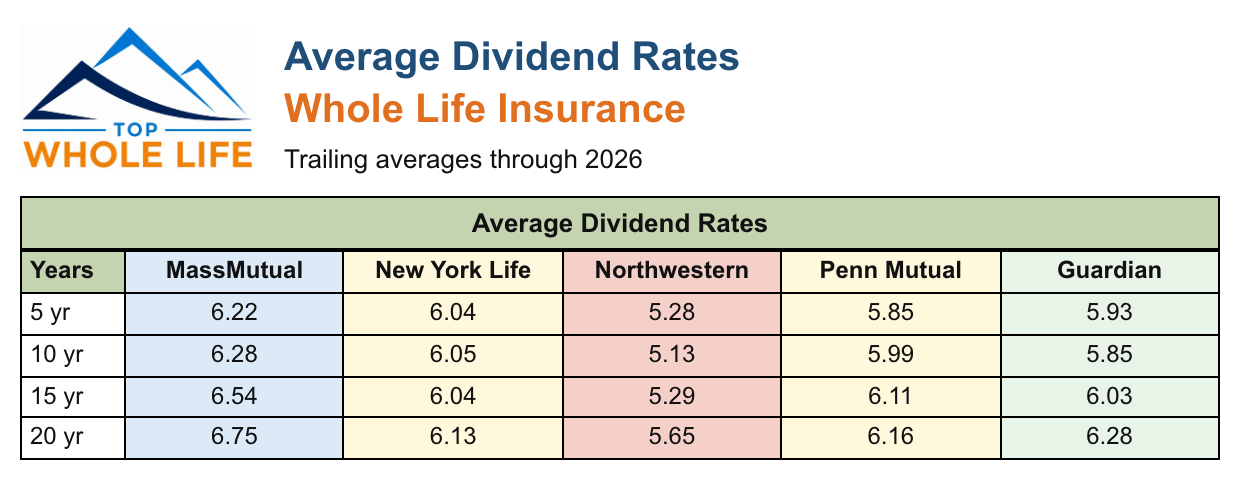
| Company Name | 5 yr avg (2026) | 10 yr avg (2026) | 15 yr avg (2026) | 20 yr avg (2026) |
|---|---|---|---|---|
| MassMutual | 6.22 | 6.28 | 6.54 | 6.75 |
| New York Life | 6.04 | 6.05 | 6.04 | 6.13 |
| Guardian | 5.93 | 5.85 | 6.03 | 6.28 |
| Penn Mutual | 5.85 | 5.99 | 6.11 | 6.16 |
| Northwestern Mutual | 5.28 | 5.13 | 5.29 | 5.65 |
Which insurance company pays the best dividend?
For 2026 published dividend interest rates (DIR) among major mutuals on this page, MassMutual leads at 6.60%, followed by New York Life (6.40%), Guardian (6.25%), Penn Mutual (6.00%), and Northwestern Mutual (5.75%). Foresters has not announced a 2026 rate at the time of this update.
“Best” also depends on policy design, direct vs. non-direct recognition, and how you access cash value — not the headline rate alone. See our top whole life companies for cash value comparison for the full ranking methodology.
Year-by-year DIR for each major mutual is below (newest first). 2015–2026 matches the comparison table at the top of this page; 2001–2014 comes from the same workbook so you can scan one carrier without reading across 12 columns. Foresters is in that workbook from 2014 only, with no published DIR from 2021 through 2026. DIR is an input to the dividend formula, not illustrated cash-value return.
Mass Mutual dividend rate history
MassMutual never printed below 6.00% in the 2015–2026 window — the floor sat there for 2021–2023 — then stepped through 6.10% (2024) and 6.40% (2025) to 6.60% for 2026 (+20 bps vs. 2025). That floor is why we still illustrate them first: a 20 bp headline gap vs. New York Life this year is noise compared with a carrier that cuts the dividend in a bad decade. Trailing averages through 2026: 5-year 6.22, 10-year 6.28, 15-year 6.54 (#1 among these five), 20-year 6.75.
| Year | MassMutual DIR |
|---|---|
| 2026 | 6.60 |
| 2025 | 6.40 |
| 2024 | 6.10 |
| 2023 | 6.00 |
| 2022 | 6.00 |
| 2021 | 6.00 |
| 2020 | 6.20 |
| 2019 | 6.40 |
| 2018 | 6.40 |
| 2017 | 6.70 |
| 2016 | 7.10 |
| 2015 | 7.10 |
| 2014 | 7.10 |
| 2013 | 7.00 |
| 2012 | 7.00 |
| 2011 | 6.85 |
| 2010 | 7.00 |
| 2009 | 7.60 |
| 2008 | 7.90 |
| 2007 | 7.50 |
| 2006 | 7.40 |
| 2005 | 7.00 |
| 2004 | 7.50 |
| 2003 | 7.90 |
| 2002 | 8.05 |
| 2001 | 8.20 |
New York Life dividend rate history
New York Life’s cycle floor in this workbook is 5.80% (2012, then 2021–2023). 2026 is 6.40% — +20 bps vs. 2025 and +60 bps off that floor. Trailing averages through 2026: 5-year 6.04, 10-year 6.05, 15-year 6.04, 20-year 6.13. The series is tight: unlike Northwestern Mutual’s long walk-down, NY Life stayed in a 5.80–6.30 band from 2012 through 2025, then printed 6.40% in 2026.
| Year | New York Life DIR |
|---|---|
| 2026 | 6.40 |
| 2025 | 6.20 |
| 2024 | 6.00 |
| 2023 | 5.80 |
| 2022 | 5.80 |
| 2021 | 5.80 |
| 2020 | 6.10 |
| 2019 | 6.00 |
| 2018 | 6.10 |
| 2017 | 6.30 |
| 2016 | 6.20 |
| 2015 | 6.20 |
| 2014 | 6.00 |
| 2013 | 5.90 |
| 2012 | 5.80 |
| 2011 | 6.11 |
| 2010 | 6.11 |
| 2009 | 6.14 |
| 2008 | 6.79 |
| 2007 | 6.79 |
| 2006 | 6.79 |
| 2005 | 6.79 |
| 2004 | 6.79 |
| 2003 | 6.79 |
| 2002 | 7.32 |
| 2001 | 7.90 |
Guardian dividend rate history
Guardian sat at 5.65% for 2020–2022, then climbed each announcement year to 6.25% for 2026 (+15 bps vs. 2025). Trailing averages through 2026: 5-year 5.93, 10-year 5.85, 15-year 6.03, 20-year 6.28. The 15-year average is competitive with New York Life; the last decade is the weaker stretch.
| Year | Guardian DIR |
|---|---|
| 2026 | 6.25 |
| 2025 | 6.10 |
| 2024 | 5.90 |
| 2023 | 5.75 |
| 2022 | 5.65 |
| 2021 | 5.65 |
| 2020 | 5.65 |
| 2019 | 5.85 |
| 2018 | 5.85 |
| 2017 | 5.85 |
| 2016 | 6.05 |
| 2015 | 6.05 |
| 2014 | 6.25 |
| 2013 | 6.65 |
| 2012 | 6.95 |
| 2011 | 6.85 |
| 2010 | 7.00 |
| 2009 | 7.30 |
| 2008 | 7.25 |
| 2007 | 6.75 |
| 2006 | 6.50 |
| 2005 | 6.75 |
| 2004 | 6.60 |
| 2003 | 7.00 |
| 2002 | 8.00 |
| 2001 | 8.50 |
Penn Mutual dividend rate history
Penn Mutual held 6.00% for 2025 and 2026 (unchanged). The useful history is the plateau: 6.34% every year from 2008 through 2018 — eleven years — while Northwestern Mutual walked from 7.50% down to 4.90%. Trailing averages through 2026: 5-year 5.85, 10-year 5.99, 15-year 6.11 (#2 among these five on 15-year), 20-year 6.16. Penn uses direct recognition; illustrated cash value can look stronger than the headline DIR suggests.
| Year | Penn Mutual DIR |
|---|---|
| 2026 | 6.00 |
| 2025 | 6.00 |
| 2024 | 5.75 |
| 2023 | 5.75 |
| 2022 | 5.75 |
| 2021 | 5.75 |
| 2020 | 6.10 |
| 2019 | 6.10 |
| 2018 | 6.34 |
| 2017 | 6.34 |
| 2016 | 6.34 |
| 2015 | 6.34 |
| 2014 | 6.34 |
| 2013 | 6.34 |
| 2012 | 6.34 |
| 2011 | 6.34 |
| 2010 | 6.34 |
| 2009 | 6.34 |
| 2008 | 6.34 |
| 2007 | 6.30 |
| 2006 | 6.30 |
| 2005 | 5.74 |
| 2004 | 5.74 |
| 2003 | 6.48 |
| 2002 | 7.40 |
| 2001 | 7.40 |
Northwestern Mutual dividend rate history
Northwestern Mutual is the long walk-down: 8.80% in 2001, 7.50% through 2005–2008, a trough of 4.90% in 2018, then a climb to 5.75% for 2026 (+25 bps vs. 2025). Trailing averages through 2026: 5-year 5.28, 10-year 5.13, 15-year 5.29, 20-year 5.65 — last among these five on every window. That is why a current-year DIR ranking and a 20-year history ranking are different questions.
| Year | Northwestern Mutual DIR |
|---|---|
| 2026 | 5.75 |
| 2025 | 5.50 |
| 2024 | 5.15 |
| 2023 | 5.00 |
| 2022 | 5.00 |
| 2021 | 5.00 |
| 2020 | 5.00 |
| 2019 | 5.00 |
| 2018 | 4.90 |
| 2017 | 5.00 |
| 2016 | 5.45 |
| 2015 | 5.60 |
| 2014 | 5.60 |
| 2013 | 5.60 |
| 2012 | 5.85 |
| 2011 | 6.00 |
| 2010 | 6.15 |
| 2009 | 6.50 |
| 2008 | 7.50 |
| 2007 | 7.50 |
| 2006 | 7.50 |
| 2005 | 7.50 |
| 2004 | 7.70 |
| 2003 | 8.20 |
| 2002 | 8.60 |
| 2001 | 8.80 |
Foresters dividend rate history
Foresters is the incomplete series: this workbook has published DIR from 2014 through 2020 only, then NA for 2021–2026. The last print is 5.80% (2020). The peak in this window is 6.83% (2016), then 6.23% for 2018–2019. Foresters historically announced on a lag versus the large mutuals; the table below follows the workbook year, not the announcement calendar.
| Year | Foresters DIR |
|---|---|
| 2026 | NA |
| 2025 | NA |
| 2024 | NA |
| 2023 | NA |
| 2022 | NA |
| 2021 | NA |
| 2020 | 5.80 |
| 2019 | 6.23 |
| 2018 | 6.23 |
| 2017 | 6.58 |
| 2016 | 6.83 |
| 2015 | 6.65 |
| 2014 | 6.42 |
Final Opinion
We used the tables above, and in addition, we used the dividend analysis found at InsuranceProBlog to add more validation to our results (2016 Whole Life Insurance Dividend Analysis (theinsuranceproblog.com)).
Our rating for current whole life dividend strength (headline 2026 DIR plus trailing averages — see each carrier table for the year-by-year series):
#1 MassMutual whole life insurance review
Highest 2026 DIR among these five, and #1 on both the 10-year (6.28%) and 15-year (6.54%) trailing averages. That combination — not the 6.60% print alone — is why it is our best pick for dividend strength.
#2 New York Life whole life insurance review
Second on 2026 DIR. Ratings and consistency are the story: 10-year average 6.05% and 15-year 6.04%, with a 5.80% floor rather than a multi-year collapse.
#3 Guardian whole life insurance review
Third on 2026 DIR. 15-year average 6.03% is close to New York Life; the 10-year (5.85%) is the weaker window after the 2020–2022 5.65% hold.
#4 Penn Mutual whole life insurance review
Fourth on 2026 DIR, second on 15-year trailing average (6.11%). The 2008–2018 6.34% plateau is the stability case. They use direct recognition; illustrated cash value can look stronger than the headline rate.
#5 Northwestern Mutual whole life insurance review
Fifth on 2026 DIR (5.75%) and last among these five on every trailing-average window. The 2001–2018 walk-down (8.80% to 4.90%) is why a current-year ranking and a 20-year history ranking are different questions. 2026 is the highest print since 2012’s 5.85%, still last vs. these peers.
Do you have a dividend-paying whole life that you would like us to add?
The dividend rate is not everything. However, it helps grow top whole life companies for cash value.
To learn a little bit more about whole life insurance you should read:
whole life insurance for beginners
overfunded cash value life insurance
how much whole life insurance costs
comparing insurers the mutual and stock insurance company